
“The Field was Never Flat”, but can be with Emerging AgTech
Emerging pathways to more precise, practical and scalable biological agriculture
By Gabriel Violento, PhD in Agricultural Science, Technology and Innovation, Global BioAg Innovations (Brazil)
From the highway, a soybean field in the Cerrado looks like one even, green sheet. The combine’s yield monitor tells a different story. By the end of harvest, the map shows dark green bands where the crop paid and red patches where it did not, inside a plot that looked uniform from the road. Growers have always known their fields vary. Over thirty years, Brazil learned to measure it.[cite: 61]
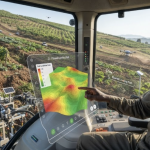
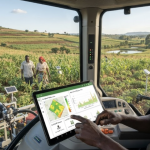
Bioinputs bring that variability back to the center of the discussion. An inoculant is a living organism, and how it performs depends on soil type, moisture, temperature, the crop and the timing of application. Yield maps, georeferenced sampling and management zones exist precisely to see that kind of difference within a field.[cite: 61]
Brazil has both ends of the problem covered. It has done its own precision agriculture research since the 1990s, with the first symposium at ESALQ/USP in 1996, Embrapa’s first projects in 1999, the ConBAP congress since 2004, and the national association, AsBraAP, since 2016. It is also one of the world’s great laboratories for biological inputs. What is still missing is the link between the two. To understand where that link breaks, I spent a day in the field in July and interviewed agronomists Pedro Justin and Thiago Cunha, partners at Plantar.[cite: 61]
WHAT PLANTAR SEES IN THE FIELD
Plantar Planejamento e Assistência Técnica is an agronomic consultancy specializing in precision agriculture. Justin and Cunha provide planning and technical assistance to grain growers in a Cerrado region dense with center pivots, one of the most technology-intensive areas in the country, with more than 250,000 irrigated hectares and farm revenue above R$ 10 billion. Many of the farms they advise run RTK guidance, telemetry and sensors on every implement. Even so, by Justin’s reckoning, a farm typically uses 10 to 20 percent of what each system can do. The basic knowledge that research settled years ago is available, and it sits idle.[cite: 61]
National surveys point the same way. In the 2020 survey by Embrapa, Sebrae and INPE, 84 percent of farmers used at least one digital technology, but only about 17 percent used remote sensing, while georeferenced maps and variable-rate application remained minority practices. In Mato Grosso, across the 2013/14 and 2014/15 seasons, researchers found that 27 percent of combines had auto-steer and yield mapping installed but unused.[cite: 61]
I don’t read this as indifference on the grower’s part. A yield map is not an instruction. When several combines harvest the same field, as they routinely do on large farms, one poorly calibrated sensor can paint a red stripe that looks like a yield loss and is nothing more than machine error. Getting to a reliable map takes filtering, calibration and agronomic judgment, and the group at the Federal University of Mato Grosso has spent years adapting that work to the Brazilian soybean harvest, with fast machines, moist grain and little time before the next crop goes in.[cite: 61]
The field conversations turned up worse cases. A satellite service sold as able to read the plant’s radiation. Fertilizer sold by the tonne that will never dissolve into an available nutrient. Growers have gone from too little information to far too much, and a good share of it does not hold up. With that much noise, the filter has to be an agronomist who can recognize a real answer.[cite: 61][cite: 62]
Researchers distinguish operational precision, the machine knowing where it is, from agronomic precision, knowing what decision that spot in the field calls for. Brazil has solved the first. Using bioinputs well depends on the second.[cite: 62]
THE MAP IS A HYPOTHESIS
A satellite image picks up a patch of weaker vigor. The cause could be fertility, water, compaction, a pest, disease, a planting failure or a stretch of shallower soil. The image records the symptom and says nothing about the cause.[cite: 62]
Lucas Rios do Amaral, who researches precision agriculture at the University of Campinas (Unicamp), writes that delineating management zones still leans heavily on the tacit knowledge of the field technician, and that digital tools are unlikely to replace the agronomist who sits down with the grower and asks why one corner of the field behaves the way it does. He proposes a test. If the data layer used to draw the zones does not correlate with the soil property you are trying to manage, there is no point in using it.[cite: 62]
André Freitas Colaço, of ESALQ, points to another mismatch. Even in variable-rate application, the data is often fed into generic, simplified recommendation tables that do not reflect the complexity of the local system. The data going in is sophisticated and the decision rule is blunt. Bioinputs run the same risk, because placing a biological product by zone only makes sense if the decision rule accounts for the conditions that drive its response.[cite: 62]
WHERE THE NUMBERS ADD UP
The best-documented gains in Brazil come from the simplest application: georeferenced soil sampling with lime and fertilizer at variable rates. In a master’s thesis at the Federal University of Rio Grande do Sul (Artuzo, 2015), based on questionnaires sent to soybean growers in the state, about 82 percent of producers reported using less fertilizer after adopting variable rate. Longer adoption was associated with lower fertilizer use, lower cost per hectare and higher yields, and soybean production came in 13.88 percent above the conventional system. These are figures reported by adopters, which calls for caution, but the logic holds.[cite: 62]
For Cerrado soils, Embrapa has recommended a two-step approach to fertilization for decades. First you correct the soil, with lime for acidity and phosphorus and potassium built up to levels where they stop limiting the crop. Only then do you size the fertilizer rate, by what the season’s crop will demand and by what the last harvest carried away. With management zones, correction goes only where it is needed.[cite: 62][cite: 63]
Replacement changes from crop to crop. According to Embrapa’s Documento 288, each tonne of soybean grain removes about 52 kg of N and 22.5 kg of K2O. A tonne of maize grain removes about 3.5 kg of K20, because most of the potassium the plant took up stays in the stalks and leaves. In a soybean and maize succession, soybean sets the potassium balance. Nitrogen is a different account, and that is where biology comes in.[cite: 63]
With soybean prices well below recent highs and credit expensive, spreading inputs evenly over soil that does not respond evenly costs money growers do not have. Justin and Cunha describe a contrast they see often among growers: some decide when to plant by the calendar, While wait for the information before deciding. Under the same weather, that difference in method shows up in the harvest.[cite: 63]
BIOINPUTS BY MANAGEMENT ZONE
Brazil’s largest-scale bioinput is the soybean inoculant. The crop gets most of its nitrogen through biological fixation by bacteria of the genus Bradyrhizobium, and Embrapa estimates this saves the country on the order of US$8 billion a year in nitrogen fertilizer. Re-inoculating seed every season lifts yield by about 8.4 percent on average. In 2020, Decree 10.375 created the National Bioinputs Program and put the subject into agricultural policy.[cite: 63]
Green manures belong in the same budget. In Embrapa trials, velvet bean (Mucuna aterrima) and jack bean (Canavalia ensiformis) gave yields comparable to 80 to 100 kg/ha of mineral N, and sunn hemp and other Crotalaria spp. supplied a large share of the nitrogen for the maize that followed. Legumes also cycle potassium and other nutrients. In a nutrient budget drawn up by management zone, that means subtracting from the fertilizer bill what the biology is already supplying.[cite: 63]
A biological product does not behave like a stable chemical dose. It responds to soil, moisture, temperature, crop and timing. That is why the maps and zones already guiding lime and fertilizer could, in principle, show where a bioinput is most likely to respond, instead of applying it evenly across a field where part of the area will never pay it back.[cite: 63]
This integration is at an early stage, and that is where the opportunity lies. Zone delineation and on-farm experimentation methods exist. What is missing is quantified evidence linking spatial data to how each bioinput performs, and strip trials inside commercial fields are how that evidence gets produced.[cite: 63]
Scale is not the problem: according to Conab, Brazil planted about 81.6 million hectares of grain in the 2024/25 season, close to 47 million of them soybean. Add a fast-growing biologicals industry and the digital tools already sitting on farms, and few countries are better placed to turn zone-based bioinput placement into a technical recommendation.[cite: 63]
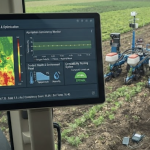
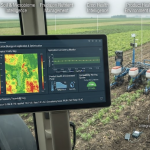
For most farms, the way forward does not run through expensive machinery. Free Sentinel-2 imagery shows a field at 10 m resolution every five days, and a technician who can read a vegetation index can bring spatial analysis to a property that will never own a variable-rate spreader. The bottleneck is people. Brazilian researchers note that a large share of newly graduated agronomists leave university without a course in precision agriculture. Artificial intelligence is starting to help organize spreadsheets and cross-reference data layers, but it is still at the research and pilot stage, and the result depends on the quality of the data and the validity of the model.[cite: 63]
LESS NITROGEN LOST
According to Embrapa, crops take up less than half of the nitrogen applied as synthetic fertilizer. The rest ends up in water or in the atmosphere as nitrous oxide (N2O), a potent greenhouse gas. Every kilogram not applied, because the map showed it was not needed or because biological fixation met the demand, is a kilogram less pollution. Precision agriculture decides where to apply. Bioinputs reduce how much synthetic fertilizer is needed.[cite: 63][cite: 64]
In 2021, the FAO, the World Health Organization, the World Organisation for Animal Health and the UN Environment Programme adopted a shared definition of One Health, which treats human, animal, plant and environmental health as interdependent. The field is where soil, water, plants and inputs meet, which is why farming belongs in that picture.[cite: 64]
The environmental gain depends on the agronomy. A biological applied outside the conditions it responds to is wasted, and a variable-rate map built on bad data sends inputs to the wrong place.[cite: 64]
For decades, precision agriculture invested in making machines execute better, and Brazil got there. Bioinputs open a new front for the same set of tools. Fertility maps, management zones and strip trials can show where each biological product responds best and how much of the nitrogen biology is already supplying. With that information, part of the synthetic fertilizer comes off the bill, the cost per hectare falls, and less nitrogen reaches water and the atmosphere.[cite: 64]
The field was never flat. For bioinputs, knowing that variability shows where each product is most likely to respond, and Brazil already has the tools to use it. The next step is to connect precision agriculture with biological inputs, turning field-level data into better, more targeted decisions and practical decisions for growers.[cite: 64]
BioAg World Digest | Summer 2026

Leave a Reply